Storage Class 1-4 Out Now - June 10, 2019
The storage applets for chapters 13, 14, 16 and master storage are out now for any user with a professional level subscription.
To use these applets, go to your dashboard (/apps) and select the chapter you want, or use the master storage applet to determine which chapter applies to your situation.
If you don't have a professional subscription and would like to try the storage applets before buying, send us an email at support@fsc-inc.com or use the messenger in the bottom right corner of your screen. We will be happy to do a short walk-through and credit your account with a month of access.
Storage Applet Preview - March 27, 2019
I’m excited to announce we’re working on an application for iCalc everyone in the sprinkler industry can be excited about: protection of storage in NFPA 13.

These chapters are 320 complicated pages (in the 2019 handbook). They’re great at providing proven ways to protect storage, but with the conservative and empirical approach taken, it can be hard to save water or reduce costs. Storage creates many challenges for the designer, not the least of which is too many variables to track which approaches are allowed and which are better. This is about to be a lot easier.
The idea behind our applet is simple: a user can see what their options will be, in minutes, not hours. By selecting “Control Mode Density Area”, “ESFR”, or “CMSA” and answering basic questions, options for protecting the structure will be listed in a fraction of second. It allows you to weigh the pros and cons of different approaches in a few minutes, giving a clear roadmap to your design from day one. For each sprinkler type available, iCalc displays a comparison of water supply requirements.

A big struggle of sprinkler designers is meeting different years of the standards, and this applet will help. By simply selecting which year of the standard is being used, different citations and requirements are seamlessly dropped in so you never miss a beat. Citations show the relevant NFPA sections so you can do further research easily, and a PDF export allows simple creation of professional reports.
If you’ve ever done a storage sprinkler design, you know first hand how difficult the standards can be to analyze. A later update will give you a checklist so requirements aren’t missed when the system gets built. This checklist will only have questions pertaining to your design and keep distracting material out of the way.
This applet has been a long time in the making. Protection of storage has been a rapidly growing unit for our engineering consulting business, and we’re excited to be able to bring something to a wider audience. The density/area applet we released last year was a proof of concept, to show how such an application might work on a smaller scale. We believe these applets will help the fire protection industry meet the growing needs of building owners to protect storage facilities without slowing down their projects.
The applet will likely be available as part of an iCalc professional subscription, or a stand-alone software for smaller companies. To check out video demos of how it is going to work, refer to our sneak peek here:
Haven’t tried iCalc yet? Get a month free when you sign up today
Want to stay up to date with this applet? Get emails from us.
Why Your Excel Sheets are Likely Wrong - Sept. 21, 2018
In fire protection, we see a lot of excel sheets. They’re used everywhere, from calculating water supply, friction losses, to recording flow tests. This might be a bigger problem than many realize.
First, I'd like to say two things:
- Excel is a great tool and does have valid uses
- Disclaimer: I’m biased--I have a vested interest in you not using it as I run a software company
With that out of the way, let’s dig into why excel isn’t a good idea for your business.
To do a job well, you must use the correct tool. Excel is a tool for sketching out ideas. Spreadsheets are great for collecting data, being a common medium for people to understand, and sketching out a new calculation. What they are not good for is business processes.
They don’t work well for something that needs to be done and re-done. They are dangerously error-prone. A study from the University of Hawaii compiled research over the years on excel sheets across major companies and found that 88% of the documents had critical errors in them that caused them to be incorrect. Clearly, 88% isn’t a fluke error here and there—humans are systemically bad at both entering information and catching errors in a review. These were sheets that intelligent and well-trained professionals considered ‘reviewed and ready for use’. One mistake was found in the course of the study that involved a 7 million dollar transfer of money.
This makes sense when you consider that the average error rate per cell is 5%. In most excel applications, one error anywhere means the bottom line result becomes wrong too. Thus, the probability your bottom-line answer is wrong increases exponentially with every input to the bottom line answer.
Of course, all human endeavor involves mistakes and errors. That’s why we are careful and check our work. What makes spreadsheets different (and especially inaccurate) is that proper time and care are rarely spent to create something quality controlled. Many underestimate the investment of time required here.
To properly quality control an excel document increases the time to develop them to outrageous proportions. Companies turn to excel to avoid the cost of buying or developing software. What they are in effect doing then is skimping on the cost of quality control processes programmers put into programs.
Can you really bear the chance that almost 9 in 10 of your calculations are wrong on engineering documents? If not, I’d suggest investing in tight quality control of your processes you use to perform your calculations. There are many great options out there, some free and some not.
Most fire sprinkler companies don’t have the resources to invest in building their own software, which is why we built iCalc. Splitting the cost of the software over a subscription allows small companies to afford access to great software that they otherwise could never get on their own.
-Philip Eckert
The study from the University of Hawaii: http://panko.shidler.hawaii.edu/
Affinity Laws - Sept. 4, 2018
The affinity laws are a set of mathematical relations that govern pump performance. Their mathematical backing is fascinating in its own right, but they have practical applications for pumps in fire sprinkler systems too.
There are two sets of them:
If impeller diameter is held constant:
- The speed of the pump is proportional to the flow generated.
- The square of the speed of the pump is proportional to pressure generated.
- The cube of speed of the pump is proportional to power.
The affinity laws can also figure changes in a pump’s performance for different diameter impellers assuming a constant shaft speed. Those relationships are useful when decided to trim an impeller. They are as follows:
- Flow is proportional to the cube of the impeller diameter
- Pressure is proportional to the square of the impeller diameter
- Power is proportional to the power of 5 of impeller diameter
Affinity laws are not accurate at extremely high multipliers--important to know if one is using them to deal with vastly different pump specs. For most practical purposes, the affinity laws work well and are accurate. In extreme cases, it is recommended to interpolate pump performance from good data. This is because the affinity laws are only valid for constant efficiency systems--which don’t exist in the real world. The differences in efficiency just typically aren’t enough to cause serious margins of error when multiples are low. Using them for trimming an impeller diameter by more than 20%, for instance, is not a good idea (the changes in efficiency are large in this case). Additionally, when trimming an impeller diameter, fire pump professional typically use a different relationship:
With shaft speed held constant, power is proportional to the power of 3 of impeller diameter.
This is because trimming the impeller fundamentally changes its shape, and the space between it and its casing. The true affinity laws are only for theoretical situations of perfectly similar geometries, but at different diameters--a situation that does not exist in the real world when trimming an impeller.
But, it is safe to use the affinity laws to determine answers for questions such as
“How much faster will the shaft have to spin to get 20% more flow?”
“How much faster will the shaft have to spin to get 10% more pressure?”
In this case, we assume a constant impeller diameter. Let’s look at these examples one by one:
To get to 20% more flow, using affinity law 1:
- New speed = (New flow / old flow ) * old speed.
- Assume we are going from 1000 GPM to 1200 GPM, on a pump that was previously spinning at 1,500 RPM
- New speed = (1200/1000) * 1500 = 1800 RPM
- In other words, 20% more GPM requires 20% more RPM
To get to 10% more pressure, using affinity law 1(b):
- New speed = (New pressure / Old Pressure)^2 * old speed
- Assume we are going from 100 psi to 110 psi, on a pump that was previously spinning at 1,500 RPM.
- New speed = (110 / 100)^2 * 1500 = 1815
- In other words, 10% more PSI requires 21% more RPM
Pump RPM can be adjusted by changing the motor to have more or less poles. The pump’s speed is a function of its power source and number of poles. Generally, a 60hz motor will spin at multiples of 60, and a 50hz motor will spin at multiples of 50. Note that because of ‘slip’ the numbers won’t be exact, so it is normal to see a 60hz pump spin at a number like 3575 RPM.
Knowing all these variables allows one to somewhat accurately predict a change in pump performance if the motor is changed, or if the impeller is trimmed. Clearly, predicting these things can get hairy and be wrong for numerous real-world complexities. However, the affinity laws are a useful tool to have in your back pocket. A pump manufacturer can help select the right pump for a project, so its best to ask them how to get what you need out of the pump.
Additionally, as a side note, one could theoretically derive the size of an impeller only using the RPM, and PSI by calculating velocity:
- V=2πRF gives velocity, V being in ft/s, R being impeller radius in ft, F being the speed in radians/second
- V=sqrt(2GH) also gives velocity, G being constant of gravity, H being psi/.433
Introduction to Base of Riser Applet - Aug. 17, 2018
We have reworked the Base of Riser applet, so it's a good time to introduce it to our users. I’d like to talk first about what the applet does, then explain our rework. Many of you may not have used the applet yet as it is so new.
Base of Riser is somewhat inspired by an old program our founder Hasu created called EXIST that he sold alongside his more popular WATER. It was designed to evaluate existing systems. Base of Riser also works great for checking the design work on a new system between the base of riser and flow test, where traditionally a lot of designers don’t handle.
Base of Riser has one big goal: determine if the water supply will be enough for the sprinkler system, or if a pump or tank will be needed. It operates off of the riser tag, so information on the design criteria or sprinkler system is not needed. The applet sets up three sections, the flow test point, the riser point, and all piping in between. It then accounts for the differences between the flow test point and the riser point to determine the sufficiency or deficiency in the water supply by stepping through the piping between and analyzing friction losses.
As we initially built the applet, it proved useful. The feedback we got from users was that it was much needed but it wasn’t quite enough. Two problems emerged:
- There wasn’t a good way to save a project. This was frustrating to users that had to re-enter data every time they wanted to update a project.
- The piping between the flow test and riser was limited to a single line, while users needed functionality for loops between the riser and flow test.
To try and meet these concerns, we reworked the applet. Now it is no longer a single-use applet (like many of our other tools). Instead, upon coming to the applet homepage, the user will see a dashboard of all their previous projects. Additionally, each project has its own dashboard page to edit, create, or delete inputs, piping, or loops. Loops are now added in another page, to limit them to only piping already in the main line.
Base of Riser is a powerful tool for anyone doing plan review as it creates a quick way to ensure an existing system remains functional. It’s also a great tool for sizing piping in a new construction, as two reports can be produced for the same project, one with up-sized piping. This means an engineer can quickly show an owner that, in certain cases, they can size up piping and not have to pay for a pump—resulting in a huge cost savings.
This is where you come in. This applet got a lot of functionality very fast, and we’re still thinking of new ideas for it. Right now we aren’t happy with the constraints on loops, and we’re worried the interface is confusing for those used to a more classic ‘drag-and-drop’ interface. iCalc is an iterative process, a constant conversation between its users and the team to make it better. Base of Riser is early in this process. What do you think of the new applet? Is it helping you save time or is it not there yet? What can we change to make it better for you? Email me what you think at phil@fsc-icalc.com.
Hopefully base of riser becomes a tool that brings value to our users. The possibility of being able to get this analysis done quickly promises great time-savings and reduction of a huge documentation headache for its users. Only time (and our users) will tell if it has met that promise or if it needs more work.
First Steps: Delegated Design Process - July 27, 2018
Delegated design is a lot simpler for the engineer than a detailed layout, but it presents its own unique challenges. In this post, I’d like to cover the general process we follow when confronting a new delegated design job. Note that this isn’t engineering advice, and a professional engineer with expertise in the relevant areas should be consulted before making project decisions. That said, it may be helpful to get an overview of how we perform this task, as it will help align your decision making process.
Traditionally, when preparing bid documents, detailed sprinkler design is left to the sprinkler contractor. In lieu of preparing detailed fire sprinkler drawings and hydraulic calculations, there are several questions the engineer can try to answer and provide analysis that will help the owner, design team, and construction manager down the road. Looking ahead, the engineer is likely able to anticipate major challenges the sprinkler system may encounter so that there are less surprises when it is installed.
Keep in mind, a new sprinkler system must comply with IFC’s Fire Flow requirement, and the system demand requirements in NFPA 13—whichever is stricter. These two requirements will sometimes mean a pump or water tank will be required for the building. Big ticket items like these are best addressed early on in the design process, so if the engineer can recognize that they will be required before plans are finalized it is a huge help to everyone in the design process. To do this, we ask five big questions:
What is the required design criteria? (Density / Area)
What is the expected fire sprinkler demand?
What is the available water supply?
Is there adequate volume of water available?
Is there adequate pressure available?
We use the iCalc applets to get answers to these questions, namely Design Criteria, Water Supply, and Friction Loss. These calculations can be done by hand however, if you are careful to check your numbers and applicable code.
Process
The required design criteria is laid out in chapter 11 of NFPA 13. In it are the density area curves (explained in another post of ours here) of which you will select the one corresponding to your buildings’ hazard classification. On this line are combinations of water density and design fire area. Once this point on the line is selected, chapter 11 must be reviewed for increases, decreases, and exceptions. A few of the more important changes possible are:
- Section 11.2.3.2.3.1 states that if quick response sprinklers are used, then a reduction of area is allowed according to the logic contained in figure 11.2.3.2.3.1
- Section 11.2.3.2.6 states that if high temperature sprinklers are used, then the design area may be decreased by 25%
- Section 11.2.3.2.4 states that if the ceiling slope is greater than 2 in 12, the area must be increased by 30%
- Section 11.2.3.2.5 states that if a dry pipe system is used, then the area must be increased by 30%
- Section 11.2.3.1.4 states that if there are unsprinklered combustible concealed spaces, then a 3000 sq. ft. design area must be used, unless the adjusted area is larger, in which case it should be used instead.
The water supply should be analyzed by obtaining a valid flow test. Flow test data may be obtained by contacting the city where the project is located, the local water department, or by performing a new test if granted permission by the appropriate authority. After the design criteria is determined and a flow test obtained, the fixed demands of the sprinkler system should be tallied up, including:
- Rack Systems
- Water Curtains
- Inside Hose
- Outside Hose
- Elevation loss
- End Head Pressure
- Backflow Preventer Loss
- etc.
This is not a conclusive list, but it covers a lot of situations. Upon tallying all these up, if they are greater than the pressure your water supply can provide at the required flow, then you know already that a pump will be needed. You can also check the flow required here versus the flow test, which will tell you whether or not you need a tank.
The next step is to account for friction losses—something a little difficult to do if you don’t know the exact layout of piping in the system. What we tend to do is generally estimate the sections of pipe into some categories:
- Underground 1
- Underground 2
- Riser
- Bulk Main
- Cross Main
- Branch Line
Each category is then assigned a best guess of the inside diameter and length of pipe included. Combined with assumptions for C-Factors, a preliminary friction loss analysis can be done to determine (very roughly) how much pressure will be lost to friction in the system. This analysis is very helpful for situations where the water supply analysis has not left a lot of wiggle room in its leftover pressure.
After all this, only then would we begin to issue performance level drawings and issue specifications. This process should give you a better understanding of whether a pump or tank will be needed in the system, so that you may give a heads up to the owner, design team, and construction manager. Of course, the design and layout itself will be handled by the contractor in delegated design, but this process at the front end does not take long, and can save a lot of time, money, and headache incurred when plans must change.
A Look at Sprinkler Activation - May 2, 2018
By Brad Casterline:
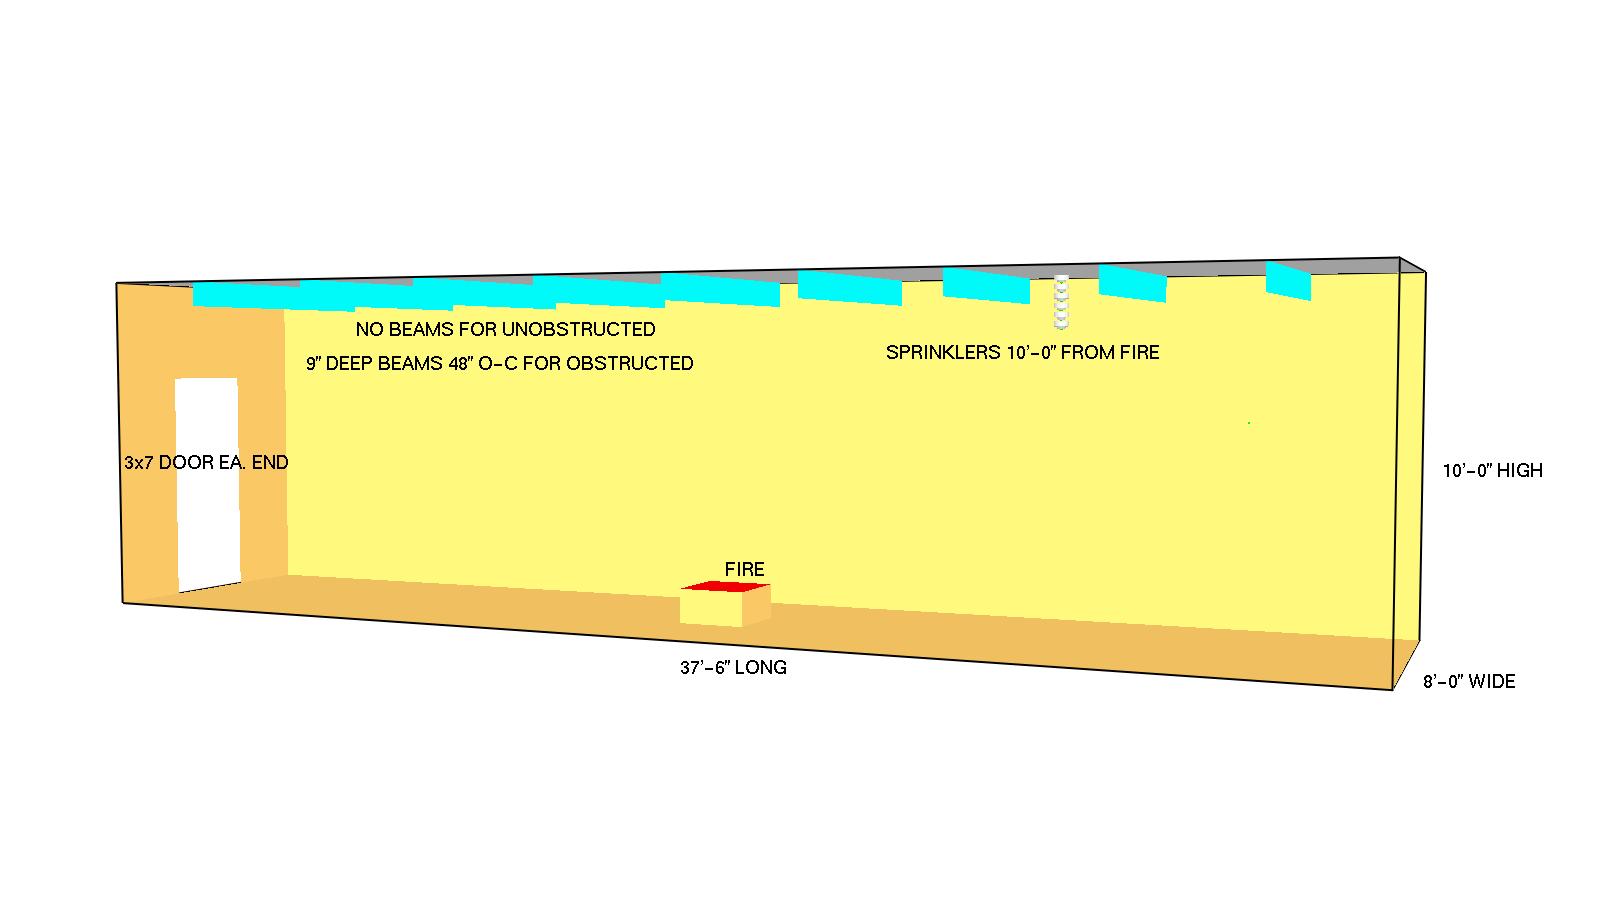
The following is a comparison of activation times for sprinklers in a 300 square feet area with a 10’ ceiling height.
The comparisons are for:
- Unobstructed vs Obstructed Construction
- 12” deep vs 48” deep Skylight
- Floor opening with and without a Draft Stop
For each scenario the following deflector distances are modeled:
- 3”, 6”, 9”, 12”, 15”, 18”
The following temperature ratings are modeled for each deflector
distance:
Activation is a combination of heat flowing across and collecting around a sprinkler. It is not the intent to try to predict activation time because that varies dependent on Fire Growth Rate, Ceiling Height, Sprinkler RTI, Sprinkler Temperature Rating, and Sprinkler Spacing, as well as Deflector Distance! By keeping 4 of these 6 variables constant for all scenarios it is interesting to look at the activation time Differences.
The above three scenarios were chosen because, before the modeling is done, one might just think they know what would happen. The little surprises are in the order of activation based on the set-up and deflector distance.
The Set-Up:
The walls and floor are ‘inert’ and the ceiling has the thermo-physical properties of 1⁄2” Gypsum.
The fire is centered width-wise in the space and there is an open 3x7 door at each end.
Six heat detectors (sprinklers without water flow) are aligned with and 10’ from the fire.
The Obstructed Construction scenario is shown. The Unobstructed scenario is identical, less the beams. The Skylights are 4’x8’ and ‘centered’ above the sprinklers. The Floor Opening is 65 square feet with the sprinklers 9” from the edge.
The fire is 1700 kW t^2 SLOW Design Fire.
Obstructed Construction
Activation Time (seconds) Quick Response 135F / 155F / 175F / 200F
3” Deflector= 239 / 265 / 293 / 324
6” Deflector= 240 / 266 / 290 / 319
9” Deflector= 235 / 262 / 286 / 314
12” Deflector= 230 / 256 / 278 / 309
15” Deflector= 226 / 252 / 274 / 304
18” Deflector= 225 / 250 / 273 / 302
Unobstructed Construction
Activation Time (seconds) Quick Response 135F / 155F / 175F / 200F
3” Deflector= 196 / 218 / 238 / 263
6” Deflector= 216 / 238 / 259 / 284
9” Deflector= 235 / 259 / 283 / 308
12” Deflector= 242 / 269 / 293 / 320
15” Deflector= 253 / 279 / 300 / 330
18” Deflector= 254/ 280 / 303 / 333
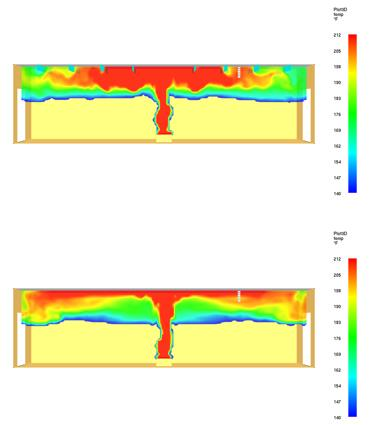
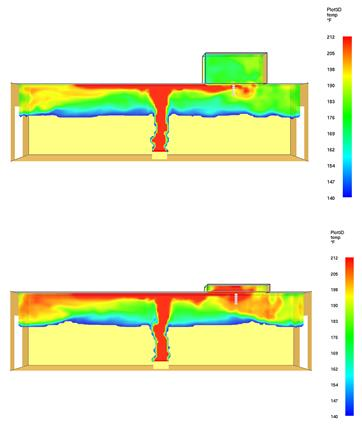
Temperature slice at 240 seconds for Obstructed Construction (top) and Unobstructed Construction (bottom). Blue is 140F, red is 212F
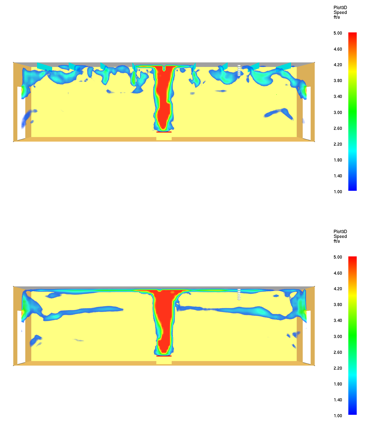
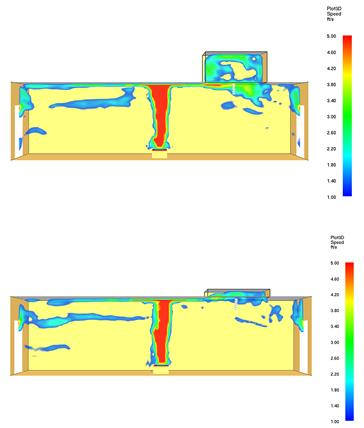
Velocity slice at 240 seconds for Obstructed Construction (top) and Unobstructed Construction (bottom). Blue is 1 ft/sec, red is 5 ft/sec
4’x8’x48” deep Skylight
Activation Time (seconds) Quick Response 135F / 155F / 175F / 200F
3” Deflector= 240 / 259 / 291 / 319
6” Deflector= 234 / 256 / 278 / 308
9” Deflector= 227 / 253 / 264 / 301
12” Deflector= 223 / 251 / 261 / 299
15” Deflector= 224 / 252 / 273 / 302
18” Deflector= 228 / 252 / 280 / 308
4’x8’x12” deep Skylight
Activation Time (seconds) Quick Response 135F / 155F / 175F / 200F
3” Deflector= 224 / 248 / 270 / 297
6” Deflector= 230 / 255 / 279 / 307
9” Deflector= 235 / 261 / 286 / 314
12” Deflector= 237 / 263 / 289 / 319
15” Deflector= 238 / 265 / 291 / 322
18” Deflector= 241 / 269 / 294 / 326
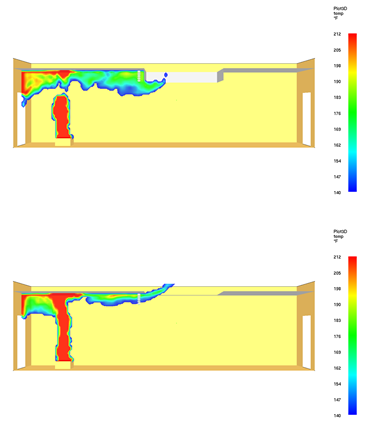
Temperature slice at 240 seconds for 48" deep skylight (top) and 12" deep skylight (bottom). See NFPA 13-2016 8.5.7.1.1. Blue is 140F, red is 212F.
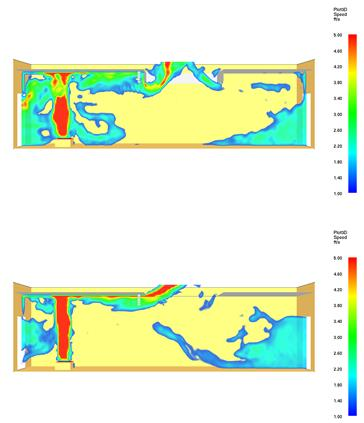
Velocity slice at 240 seconds for 48" deep skylight (top) and 12" deep skylight (bottom). See NFPA 13-2016 8.5.7.1.1. Blue is 1 ft/sec, red, is 5 ft/sec.
Floor Opening with Draft Stop
Activation Time (seconds) Quick Response 135F / 155F / 175F / 200F
3” Deflector= 207 / 241 / 273 / 312
6” Deflector= 224 / 256 / 288 / 325
9” Deflector= 238 / 268 / 302 / 341
12” Deflector= 243 / 272 / 308 / 349
15” Deflector= 245 / 277 / 313 / 354
18” Deflector= 243 / 276 / 315 / 356
Floor Opening without Draft Stop
Activation Time (seconds) Quick Response 135F / 155F / 175F / 200F
3” Deflector= 203 / 236 / 262 / 329
6” Deflector= 221 / 255 / 287 / 333
9” Deflector= 243 / 276 / 317 / 368
12” Deflector= 258 / 298 / 340 / 388
15” Deflector= 272 / 313 / 360 / 405
18” Deflector= 289 / 330 / 382 / 419
Temperature Slice at 240 seconds for floor opening with draft stop (top) and floor opening without draft stop (bottom). Blue is 140F, red is 212F.
Velocity Slice at 240 seconds for floor opening with draft stop (top) and floor opening without draft stop (bottom). Blue is 1ft/sec, red is 5ft/sec.
Reviewing History of NFPA 13 Density Curves - April 2, 2018
It’s sometimes useful to understand the history of specific parts of the standard, so we have taken a deep dive in the density area curves. The following is adapted from our presentation at OSU FireTech in March.
Back in 1969, sprinkler designs were very limited. There were only two types of sprinklers (K5.6 & K8.0). Pipe was restricted to only schedule 40, and 95% of systems were designed using the pipe schedule system. This meant hydraulic calculation at all was only performed on a small number of complex projects, like aircraft hangers, transformers, refineries, and the like. Some of the original impetus for change was actually rules the sprinkler fitters union laid out; dictating that 3 people were required on any job that included 8” sections of piping. In order to keep costs down and not strain the sprinkler fitters, these sections of pipe needed to be removed if at all possible. Pipe schedule calculations made this unfeasible, but engineers at the time were aware that the friction loss in stepping down from an 8” pipe to a 6” pipe at the beginning could be made up for elsewhere in the system. This gave a strong reason to begin looking more into hydraulic designs.
In the early 70’s, a team of people including Jack Wood of Viking, Lin McCool at National Fire Sprinkler, Chet Schirmer, Richard Hughey, and Hasu Doshi all put their efforts together to create hydraulic density area curves in an original report. This was done by taking pipe schedule systems and performing supply calculations to determine what density could be delivered by each. These densities were collated and formed into the original curves that first appear in NFPA 13 in 1972. This way, the elimination of the 8” pipe was possible--by sizing the last pipes in the system up to compensate for the loss and keeping the density delivered the same.
Density area requirements afforded engineers much more flexibility in their designs and generally helped the industry produce effective and economic systems. Over the years the curves have changed, along with adjustments and exceptions to them. In 1974 the curves were shifted to the left on the graph, and later in 1991 ordinary hazard 3 was removed while the rest of the curves were changed to straight lines. 1991 also changed the lower density requirements beteween hazards in increments of .05. The following changes also appeared over the years in shape of design area:
All sprinklers on both sides of cross-main in 1969
Circular design area in special agreement with insurance agency
Largest room design in 1974
Square area for gridded systems only in 1975
Rectangular area for all systems in 1978
Note here that the shape of design area changes several times over the years, which really affected the conservativeness of system designs by requiring more or less total demand. Another interesting note is that there is not a quantifiable description of the heat release of the different hazard groups--they were only based on pipe schedule systems. We’re currently using FDS to model different hazard groups and determine good numbers for their quantity, combustibility, and heat release rates. (Look out for our report on this in an upcoming blog post.)
Looking back, hydraulic designs seem inevitable, but it was not always how systems were designed. The flexibility afforded from the density area curves has been good for fire sprinklers.